Matlab程序开发经验分享
记录在学校的一次matlab课上的技术分享。
前言:本次分享的主要内容是介绍一些我个人Matlab开发常用的经验总结,
目的是让大家了解到matlab的优缺点、独特性、技巧,以及用什么方法解决什么问题。
Matlab是一个复杂的工具,并不是我凭借一己之力可以完全说清楚的。
大部分各种理工科离不开这一工具,而各个学科之间隔行如隔山,
我只是把自己经常使用的经验进行总结,和各位共同分享。
假设:今天不会涉及编程思想(函数式、面向对象等),主要是向大家分享如何用好这一工具。
假设各位已经掌握matlab的基本语法,并且自己也会写一些代码了。
代码优化
同样是跑代码,为什么我要等很久?
我们不得不承认,Matlab这种解释型语言比编译型语言要慢(代码在运行时会被一行一行地解释执行),
这并不代表Matlab代码不能变得高效。
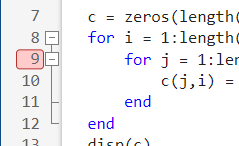
预分配内存
在进行循环语句时,应当先声明变量所需空间的大小,再进行循环,避免每次循环向数组中增加数字。
不推荐写法
1 | tic |
推荐写法
1 | tic |
为什么出现这样的差异?
反复调整数组的大小将导致花费额外的时间找到更大的、连续的内存空间。
所有类型的变量都需要这样做吗?
不一定,cell类型则不需要,但是放在cell中的数据类型可能需要。
cell数组内存不连续,但是每个cell要求连续内存。
(部分情况下cell在编译成mex文件时,同样需要初始化内存)
参考链接:
https://ww2.mathworks.cn/help/matlab/matlab_prog/preallocating-arrays.html
https://ww2.mathworks.cn/help/matlab/matlab_prog/techniques-for-improving-performance.html
https://ww2.mathworks.cn/help/matlab/matlab_prog/avoid-unnecessary-copies-of-data.html
https://ww2.mathworks.cn/help/matlab/matlab_prog/strategies-for-efficient-use-of-memory.html
向量化
官方定义:
修正基于循环且面向标量的代码以使用 MATLAB 矩阵和向量运算的过程称为向量化。
简单来说,就是替代for循环做一些简单操作,以提高运行速度、可读性、正确性。即,算法流程控制for循环,简单操作向量化。
向量化是matlab的一个重要特点,这在其他语言很少出现
向量化的语句通常有底层的支持,利用到了CPU指令集进行优化,因此速度较快,
而for循环遍历慢的原因是matlab为解释性语言需要一行一行执行。
求1至10000的每个数的正弦的和
循环写法:
1 | tic |
向量化写法:
1 | tic |
为什么all_sum这么小?
隐式扩展,求每个人每科成绩与平均值的差距
1 | % 每个人有三门课, |
循环写法
1 | mA = mean(A); % 求每列的平均值 |
向量化写法
1 | devA = A - mean(A) |
注意,在向量化写法中,mean(A)的结果是1x3大小的。即使 A 是一个 7×3 矩阵,mean(A) 是一个 1×3 向量,MATLAB 也会隐式扩展该向量,就好像其大小与矩阵相同一样,并且该运算将作为正常的按元素减法运算来执行。(广播操作)
逻辑索引,线性索引,下标索引
介绍三种索引方式的区别
一个矩阵A ,寻找这个矩阵中大于500的数字的行列数
循环方法(单个循环,获得线性索引,双层循环,获得行列数)
1 | A = magic(100); |
find方法
1 | A = magic(100); |
处处用find真的合适吗?
求矩阵A中,所有大于500的数的和
sum(A(find(A>500)))线性索引

sum(A>500))这里直接使用了逻辑索引,速度比find()更快。
重复数组
根据向量、矩阵创造大的重复矩阵。
1 | A = repmat(1:3,5,2) |
思考题:多个等间隔指针的轮盘赌如何向量化?
随机遍历抽样(SUS)
从轮盘赌选择N个结果,则需转动N次转盘。
然而这样的抽选方式存在一定的不合理性,比如某个区域在轮盘中占据较大的份额,N次转动很有可能多次选中这个个体。

现在想一次性选中多个区域,而且尽量不重复。
使用SUS只需转动一个等间隔指针的圆盘一次,转一次就可以选出所需区域。
SUS步骤
假设轮盘总值为F(可以是1),指针选择区域数目为N,则SUS具体步骤如下:
STEP1:计算指针的间距P=F/N;
STEP2:随机生成起点指针位置Start=[0~P之间的随机数];
STEP3:计算各指针的位置Pointers=[Start+i*P(其中i=[0,1,…N-1])];
STEP4:根据各指针位置,选择出N个个体。
for循环代码
1 | function sel_ind = sus_loop(fitness, sel_num) |
向量化代码
1 | function sel_ind = sus_vector(fitness, sel_num) |
参考链接:https://ww2.mathworks.cn/help/matlab/matlab_prog/vectorization.html
冗余运算
消除for循环中的冗余运算有助于提升算法的性能。能放到外层的,就放到外层。
给定一个矩阵A,要求A的每个数乘以当前行数,在加上当前列数,再加一个固定的数
1 | for i = 1:size(A, 1) % 行 |
性能分析
我的代码怎么这么慢?想改,改什么呢?
这个时候,需要使用探查器进行代码性能分析
比如对debug.m脚本(模拟禁忌搜索的过程)进行性能分析:
1 | % debug.m |
Step 1. 打开探查器

Step 2. 在探查器中运行代码
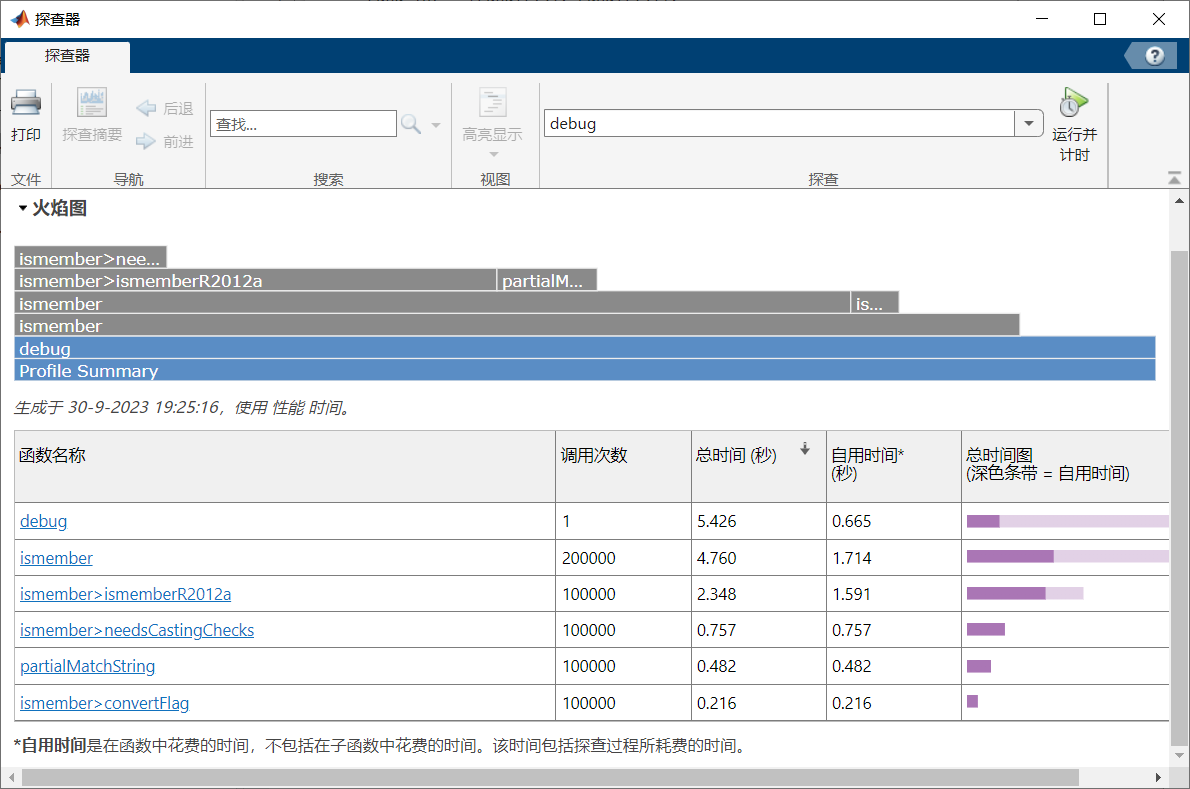
Step 3. 点击函数名称 获得具体情况
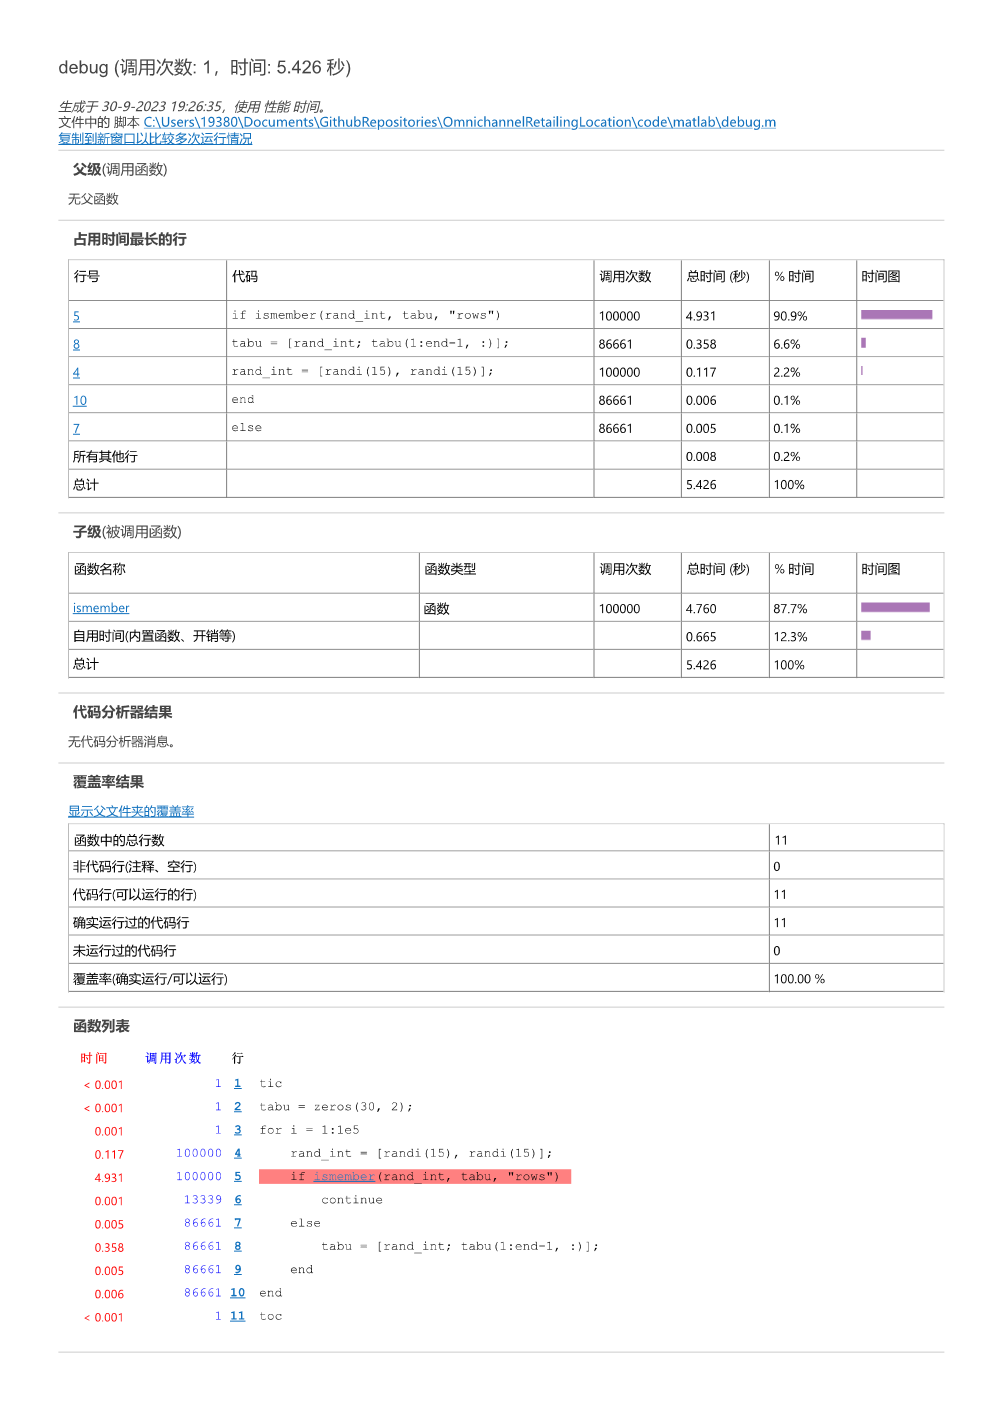
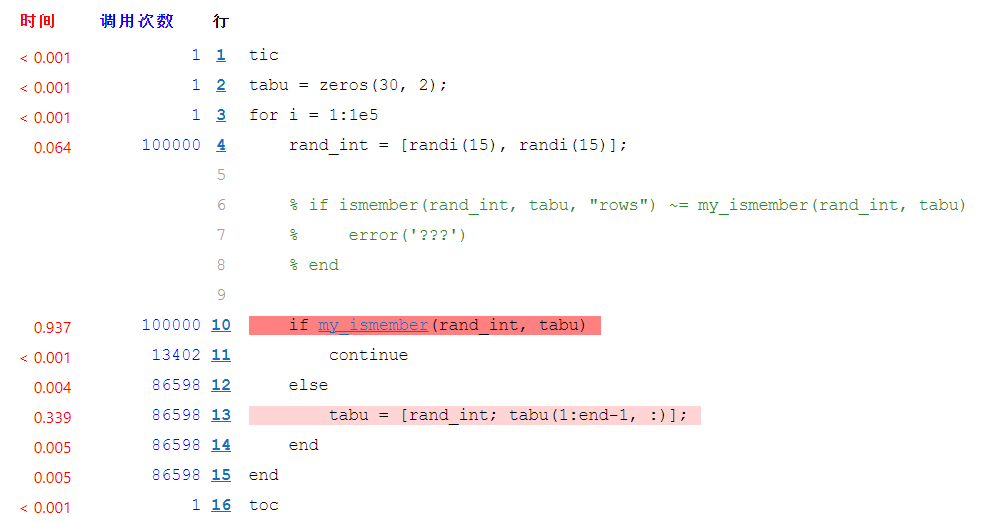
发现原来是ismember函数运行太慢了,所以根据问题特性,我们自己写一个my_ismember函数,替换原有的ismember函数。
原ismember函数耗时4.931秒,自己写的my_ismember函数耗时0.937秒。
上述例子说明:
-
不一定内置函数就足够好,一些函数内置函数为了支持各种数据类型、大小,还是很慢的
-
根据问题、数据结果特征进行重构
1
2
3
4
5
6
7
8
9
10
11
12
13
14
15function flag = my_ismember(a, b)
% 判断a是否在b中
validateattributes(a, {'numeric'}, {'size',[1,2]})
validateattributes(b, {'numeric'}, {'size',[nan,2]})
col_1_flag = b(:, 1) == a(1);
col_2_flag = b(:, 2) == a(2);
if any(col_1_flag & col_2_flag)
flag = true;
else
flag = false;
end
end注意: 探查器中运行的代码速度包括了统计时间,因此比一般方式下运行更慢。
使用更具效率的算法
有些时候,真正慢的是使用的算法的复杂度很高(甚至, 或者说是算法过于朴素),跟向量化等上述技术无关。这种慢根源于算法的复杂度,解决方法是换个思路重写。
双数之和
给定一个整数数组 nums 和一个整数目标值 target,请你在该数组中找出 和为目标值 target 的那 两个 整数,并返回它们的数组下标。
1 | % 输入:nums = [2,7,11,15], target = 9 |
暴力枚举(朴素)算法
1 | function output = two_sum(nums, target) |
字典 - 空间换时间
1 | function output = two_sum_hash(nums, target) |
工具箱
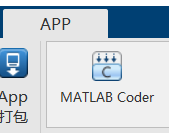
Matalb Coder
Matlab和python一样是一门解释性语言,因此运行速度不如编译型语言(C++等),因此一些复杂的函数运行起来相对较慢。
不过,Matlab Coder提供了一种方法,使得我们可以将一个函数编译成C或C++或二进制文件,供Matlab使用。步骤如下:
你需要一个Matlab Coder工具箱。如果没有,则在附加功能中获取。在顶部APP中打开Coder。

- 进入Select环节:键入你想编译的函数,注意只能是函数,不能是脚本。这里以
lagrangian_relax函数为例,然后点击next。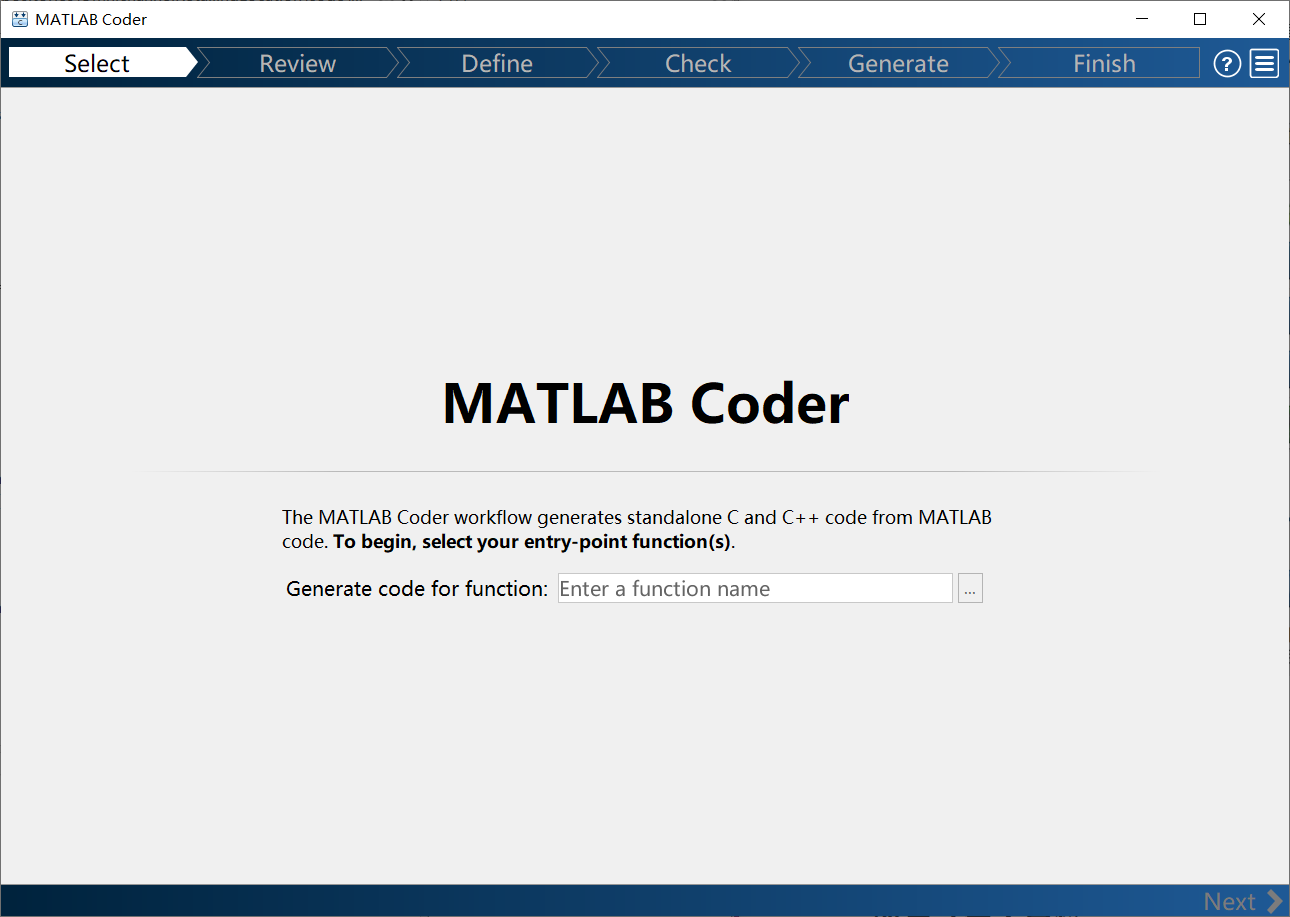
- 进入 review环节:在这个环节,Coder会检查你的代码有无问题,这个步骤会检查
lagrangian_relax函数调用的所有函数。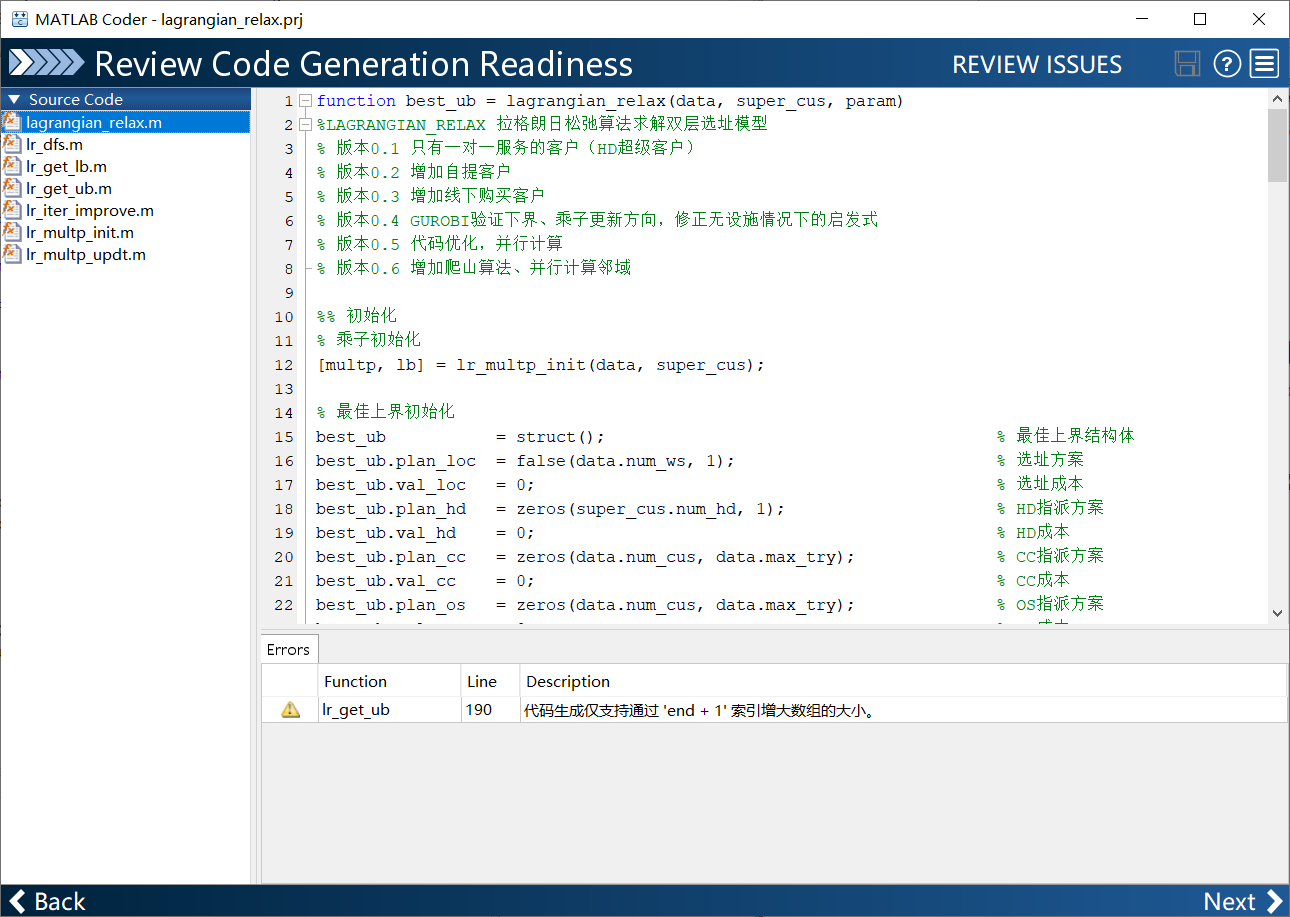
在底部出现了一条警告,此时应注意,警告和错误是不同的,程序可以有警告(前提是已知警告产生的原因和后果),错误则不同。错误将直接导致程序运行不通。
解决完所有问题后,点Next。
-
进入Define环节: 该环节定义了所有变量的类型&大小。
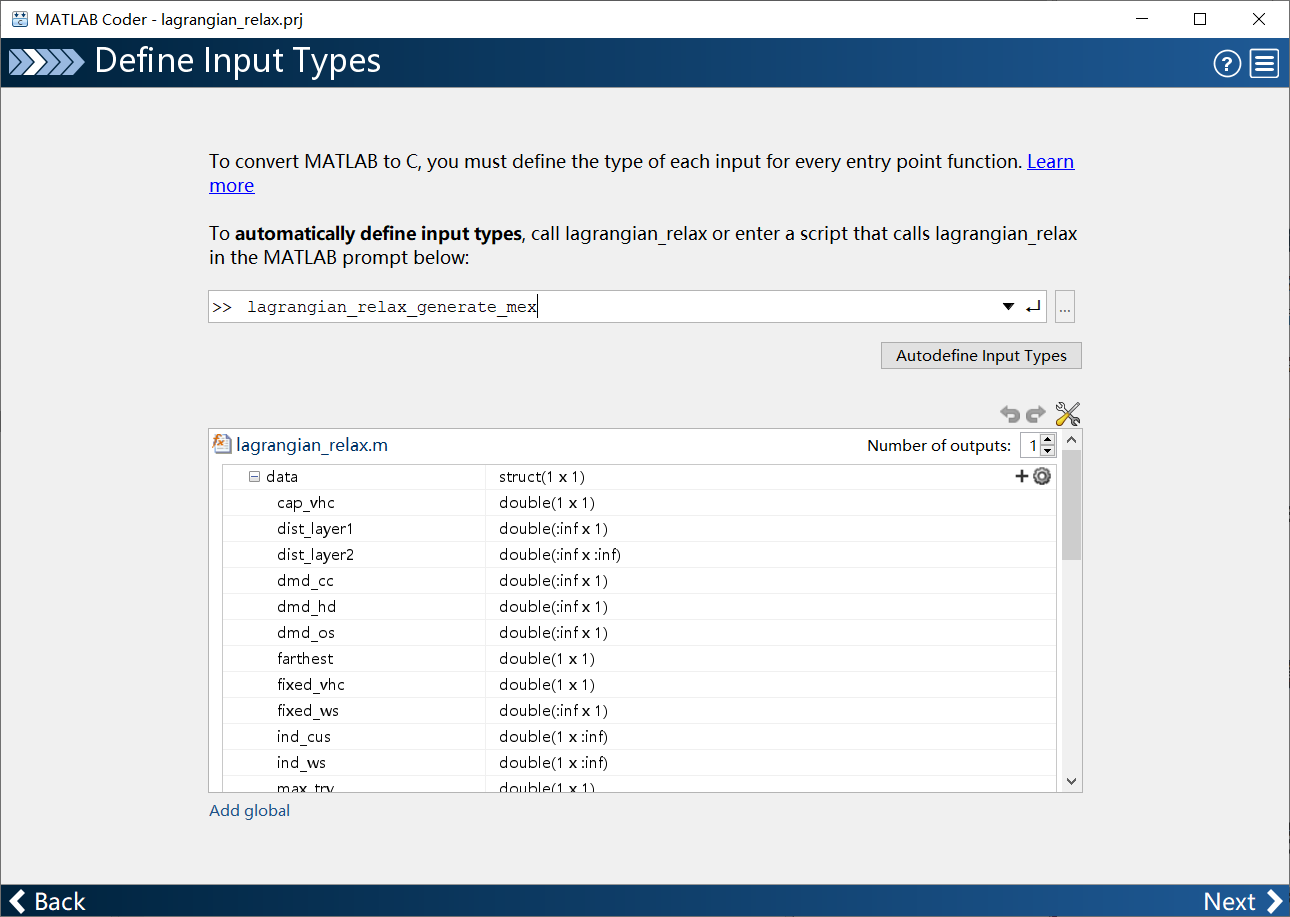
在上方的框中,输入调用
lagrangian_relax函数的脚本,然后点Autodefine Input Types按钮,等程序运行,所有的变量的大小自动确定。但是,自动确定的变量大小类型是固定的,也就是说只能输入这种大小的数据,所以,对一些不确定大小的数据,需要手动将大小调整成inf。点Next,继续。 -
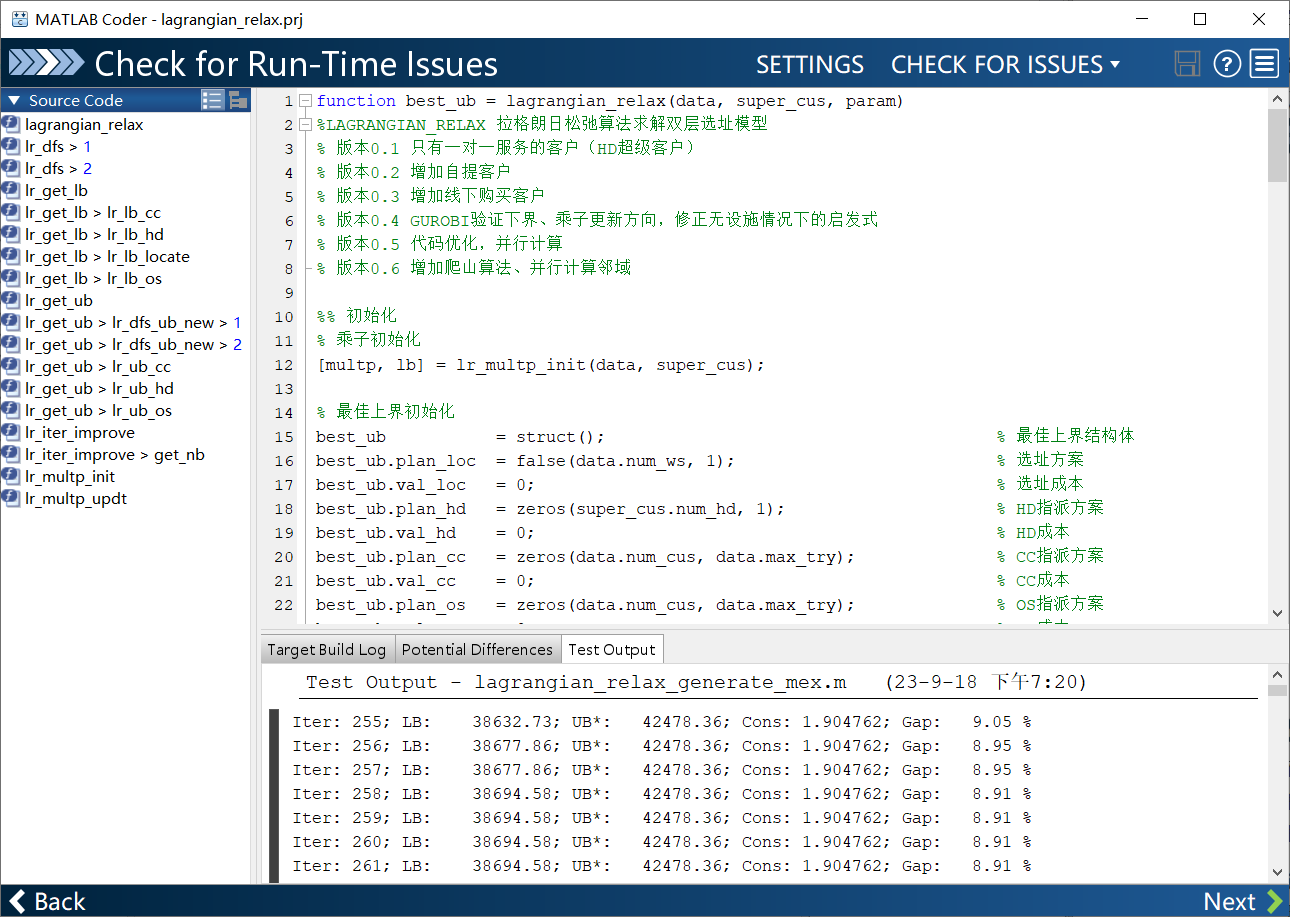
进入 check环节:Coder会运行之前输入的脚本,检查是否有运行问题、编译问题等等。这一步可能会出现各种报错,这些报错的原因并不是
lagrangian_relax函数的结果有问题,而是写脚本的习惯超出编译器可理解的范围,或者编译器认为写的不严谨,数据类型/大小匹配等一系列问题。需要逐个修改,直至通过编译。
-
进入 generate环节:如果仅仅想在matlab中调用编译好的二进制文件提升运行速度,那么选择mex即可,点Geneate等待生成。
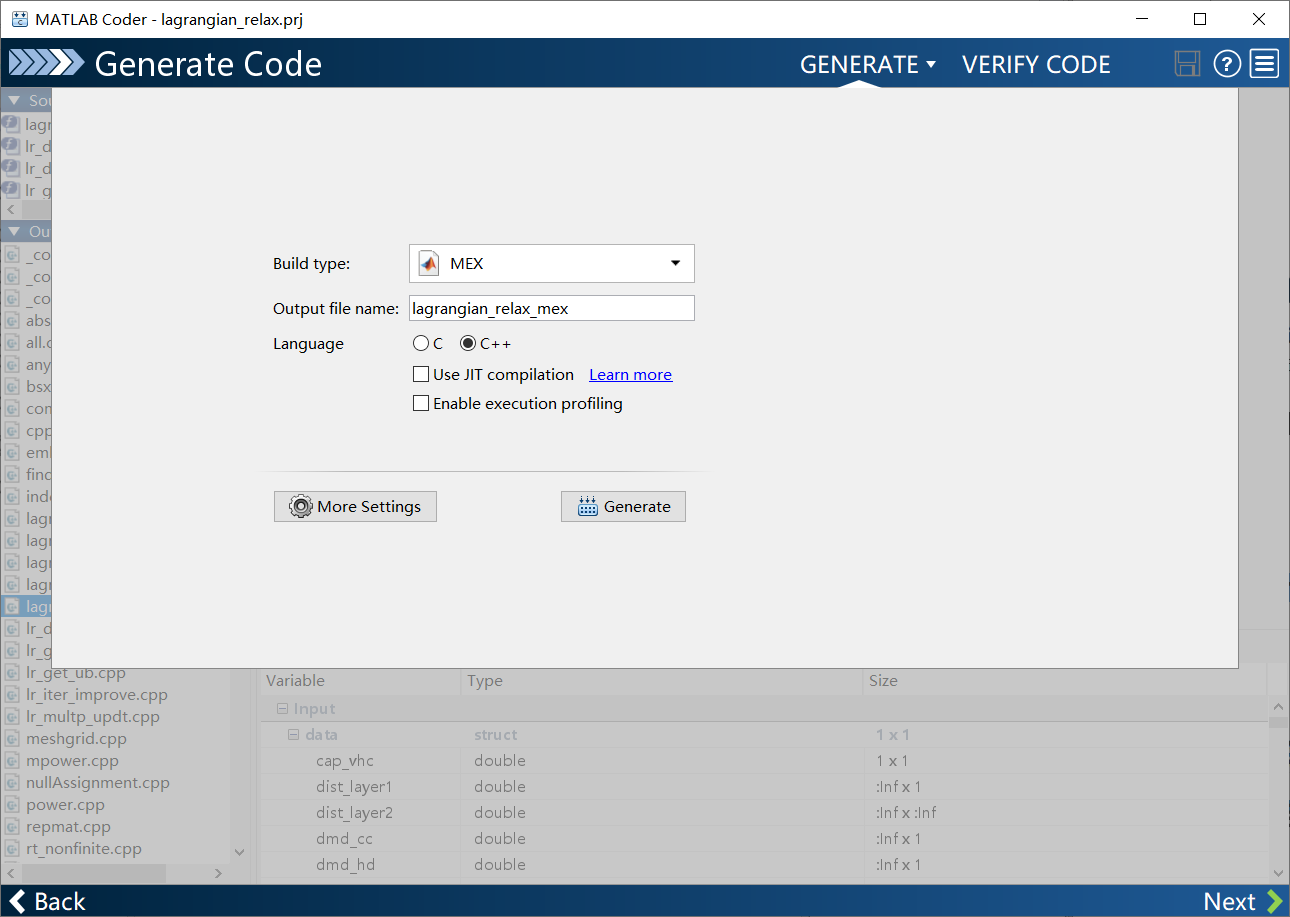
-
完成

接下来,我们就可以像使用一个普通函数一样使用这个mex文件了。
1 | tic |
可以观察到,两种方法输出的结果是一样的,但是速度差了30倍。
Coder的缺点:
-
并不是所有内置函数都支持Coder的,例如dictionary就不支持。不支持的函数会在编译时报错。
-
Coder编译的文件来源于选择的C++编译器,很可能出现mex文件在另一台电脑上无法运行的情况。
-
Coder编译的文件的另一个问题是不能跨平台,mac/win/linux编译得到的文件是不同的。
参考链接:通过生成 MEX 函数加快 MATLAB 算法的执行速度
https://blog.csdn.net/qq_36584460/article/details/110791330
并行计算工具箱 parallel computing toolbox
前面提到过利用多核心进行并行计算,需要并行计算工具箱。
该工具箱通过在本地运行的 worker(MATLAB 计算引擎)上执行应用程序,允许你充分利用多核台式机的处理能力。无需更改代码,即可在集群或云上运行同一个应用程序。还可以将该工具箱与 MATLAB Parallel Server 结合使用,以执行由于太大而无法装入单台机器内存的矩阵计算
并行for循环
1 | tic |
1 | tic |
使用场景:许多简单计算的循环,parfor将循环划分为组,以便每个线程可以执行一组。
**但是,**循环中一组循环的结果依赖前面某次循环的结果时,不能使用并行计算(归约Reduction Variables除外)。并行计算有一系列局限性,而且在一些情况下(例如,广播变量)并不能加速代码运行。
使用parfor的情况:
- 每次的for循环很慢(单个时间长)
- 简单计算的多次循环(单个时间短但是数量多)
- 多层for嵌套的外层使用parfor更具收益(思考:为什么?)
不推荐用parfor的情况:
- 已经将for向量化的情况(向量化比parfor收益更高)
- 循环已经很快了(并行化的时间开销更高,包括初始化,分配等)
强烈反对的情况:
- 向量化 -> for循环 -> parfor循环 (反向优化)
for转parfor的一个不可行举例
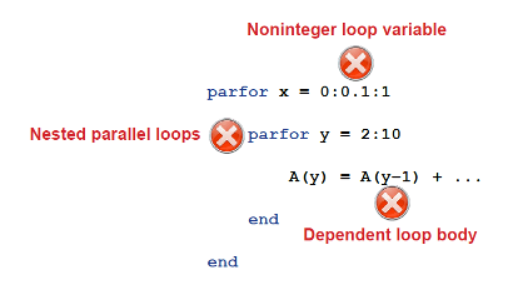
for转parfor一定程度上很复杂,有各式各样的规则限制、写法限制,这里只做一个简单介绍。关于什么时候用parfor,如何将for转为parfor,使用parfor的要求,常见问题等,参见parfor文档。
补充:parfor可以和coder结合使用,生成的mex文件也是支持多核计算的
符号计算工具箱 Symbolic Math Toolbox
符号计算工具箱,就是能计算数学公式的一个工具箱,变量不再是数值而是符号。因此可以求计算定积分和不定积分的解析解,计算符号表达式或函数的导数,并使用级数展开式逼近函数,等等。
例如,求在上的积分
1 | syms x |
这只是一个简单的例子,表示我们可以使用matlab做这件事,具体应用:
某博弈论问题求纳什均衡点
解方程组:
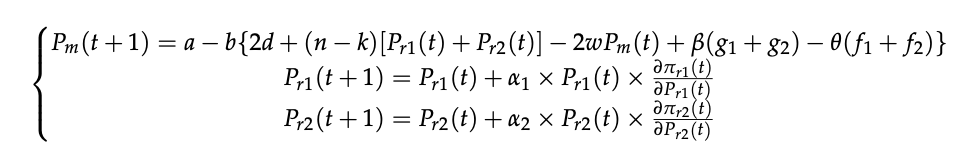
解得四个解中的一个解为纳什均衡点。
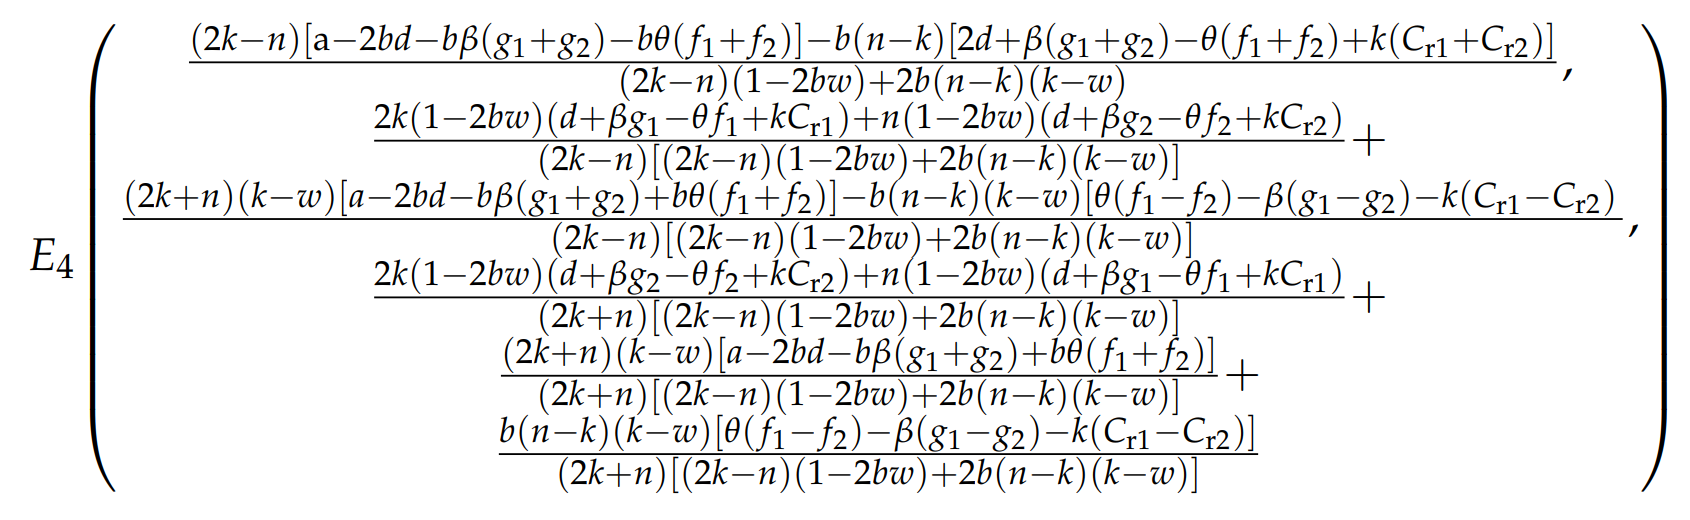
纳什均衡点的雅克比矩阵
注:符号计算工具箱不支持coder
如何查看是否支持 coder?详见函数参考文档的底部支持列表
技巧经验
使用结构体进行传参
假设你有一辆车,车长4米,平时跑72km/h,车重1000kg,载重2000kg,现在你写了一个函数f用于估计油耗。
1 | function consume = f(len, velocity, weight, capacity) |
使用结构体封装一下
1 | vehicle = struct() |
包括传出,也可以使用结构体,解决了参数记错的问题。
consume = [1, 2, 3, 4]
consume. air = 1; % 空气阻力产生的燃料消耗
consume.weight = 2; % 重量产生的消耗
...
给名字就不容易错了,比consume(1) consume(2) 这种要方便
使用句柄函数@
C = bsxfun(fun,A,B)
Binary Singleton Expansion Function
对数组 A 和 B 应用函数句柄 fun 指定的按元素二元运算。
1 | A = [8; 17; 20; 24] |
其中@gt的意思是大于"greater than", 因此生成了隐式扩展结果。
接下来,给定一个向量a和一个向量b,求的所有组合的结果。
1 | a = [1 2 3 4]; |
A = cellfun(func, C)
对元胞数组C的每个元胞进行操作。
获取元胞数组中,每个元胞的大小
1 | C = cell(3, 1); |
A = structfun(func, S)
对标量结构体的每个字段应用函数
1 | S.f1 = 1:10; |
运行日志
将命令行窗口文本记录到日志文件中
1 | diary 'myDiaryFile.txt' |
你就会得到一个myDiaryFile.txt文件,用于记录所有打印的结果。
用处:追踪程序运行状况,运行到哪次迭代?运行到哪一步?配合其他函数,还可以记录何时运行等信息。
格式化输出
格式化字符串
1 | formatSpec = 'The array is %dx%d.'; |
有什么用?多次运行一个函数,但是输入参数不同时,配合diary函数可生成结果日志
解放双手,从自动运行做起,拒绝手动保存每次的运行结果。
运行时间
想要获取运行了多久?使用tic和toc函数统计代码运行时间。
高级用法:使用多个tic测量时间
1 | tStart = tic; % pair 2: tic |
其他统计代码运行时长的方法:
多层嵌套
看这样一个代码,每月每天你孤单会想起谁:
1 | for month = 1:12 % 月 |
上述代码的问题:嵌套太多了,一层一层的嵌套。(写代码的习惯,不影响执行效率,但是影响可读性)
1 | for month = 1:12 % 月 |
使用continue关键字跳转,避免嵌套,提升可读性
Latex公式
latex是特别常用且提升效率的公式编辑方法,推荐大家使用!
好处:输入公式时,手不再使用鼠标,全键盘操作
可以使用的场景:
- word
- markdown
- latex
- mathtype
- matlab
- …
实时脚本做展示
一般不用这个功能做开发,但是实时脚本是良好的展示工具
类似于 python 的 jupyter notebook
数值精度问题
数值精度问题普遍存在于计算机语言中,我们不讨论产生数值精度的具体原因,只需要知道存在这样的问题。
例如:
1 | 0.1 + 0.2 == 0.3 |
在for循环中,需要避免以下的情况
1 | for i = 0.0:0.1:1.0 |
出现一个非常小的负数,极有可能导致bug
1 | for i = 0:10 |
在线Matlab
电脑没有matlab?只要有许可证,就能使用matlab在线编程(https://ww2.mathworks.cn/products/matlab-online.html)。
Markdown语言
本文档就是使用的markdown编写的,这是一种文本标记语言,实现文本的不同格式、样式。
如何DEBUG
断点
调试程序是每个编程语言必备的操作,没有人能完美写完一个复杂的代码并且没有任何小错误。当这些错误直观发现不了时,使用断点追踪程序每步的运算有助于发现问题。
条件断点
例如在这个循环中,每次j=3时就报错,我们增加一个条件断点,当满足这个条件时,程序暂停。
错误暂停
建议把出现错误暂停勾选,这样程序会停止在出错的哪一行,有助于分析/复现问题。

搜索问题
当一个问题,自己不能解决的时候,我们通常会使用搜索引擎进行检索,如何获得问题的答案?
例如:
我想删除一个cell数组中空的元胞,保留下非空的元胞
一般我会用 “语言 + 关键词 ”搜索
-
搜索方法:
MATLAB cell删除空元胞 -
结果质量:
- Matlab中文论坛 / 知乎 / 博客园
- CSDN(垃圾堆里找吃的,但不代表都是垃圾) / 简书
- 百度知道 (几乎驴唇不对马嘴) / 其他小网站

向他人提问
向他人提问,包括同学、老师、网友等。
为什么向他人提问很重要?正确的提问方式有助于提升双方沟通效率,快速发现问题。
错误的提问方式
-
不会截图 用手机拍照的

-
截图截一半 只截图报错信息traceback, 不截图代码的
-
不截图前后文的
为什么我这句代码报错了?

-
自己不思考、不检索,直接问别人的。
我想删除一个cell数组中空的元胞,保留下非空的元胞,matlab怎么写?
正确的提问方式(不仅适用于代码提问)
-
尽可能详细说出你的问题
-
提供代码(如果是截图,截图要全面)
-
问题如何复现
-
你已经做了什么操作,但是还是不行
-
发送之前读一读你的提问
举例 1:
举例 2:
文档
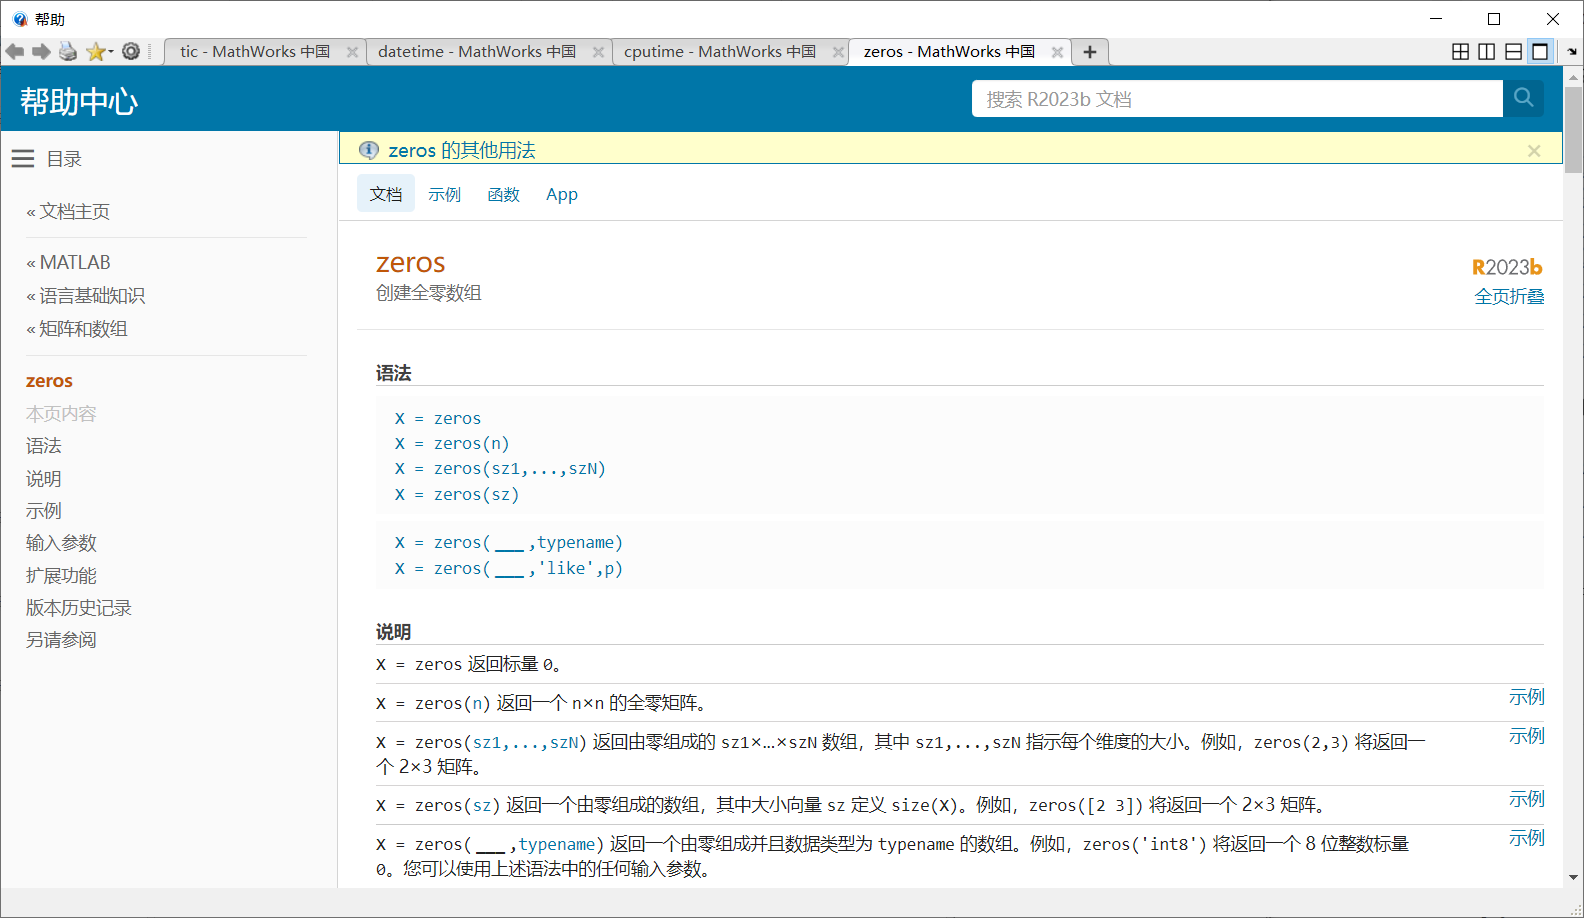
如果你知道matlab的某个函数的名字,但是不会写,那么可以在matlab右上角搜索文档,也可以在命令行中使用help 'fun_name'获得文档。
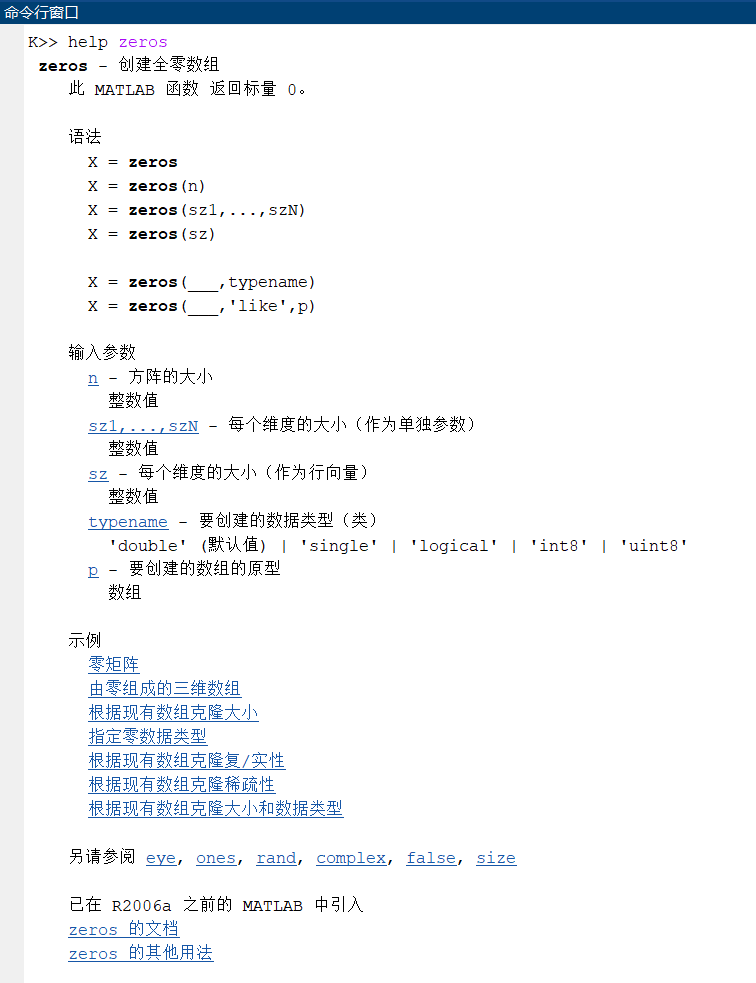
此外,在命令行中输入doc 'fun_name'可以打开在线文档。
1 | doc zeros |
外部功能
Python
很多时候,我们发现某个功能只在python中有,matlab中没有或者不如python好用。
这个时候,我们可以写一个python函数,然后让matlab调用这个py函数,再将结果处理成matlab可接收的类型即可。
举例来说,Gurobi对Python支持远远比matlab好,建模也更加方便,我们可以使用matlab调用python,python调用gurobi来实现:
首先,我们写一个python调用gurobi的函数grbpy_v.py
1 | # grbpy_v.py |
然后,我们写一个matlab脚本(函数)调用这个py函数
1 | py.importlib.reload(py.importlib.import_module('grbpy_v')); |
注意上述存在类型转换,需要把matlab的矩阵转成python的numpy矩阵才可以使用。
Gurobi (运筹优化专业)
Gurobi是一款求解器,做运筹优化方面常常会用到,这里将介绍直接使用matlab调用gurobi,不借助其他软件或包。
来源于Guorbi官方文档:
1 | function facility() |
想表达的是,gurobi对matlab很不友好:
- 系数矩阵必须是自己算明白索引后,转换为一个稀疏矩阵。
- 很难按照约束一条一条添加
- 有些gurobi功能matlab不能使用
同样模型,python的版本
1 | #!/usr/bin/env python3.7 |
Yalmip (运筹优化方向)
yalmip是一款基于matlab进行数学建模的包,或者说是一种基于matlab的建模语言,使用yalmip的好处是解决了matlab建模的痛点,并且可以调用多个求解器对模型进行求解。
然而,求解器方面,如果用gurobi / COPT,则一般使用python建模。如果用cplex,则使用java。
如果不会别的语言,必须使用matlab进行建模和求解的话,yalmip无疑是最好的选择。
gramm(画图)
gramm是基于matlab开发的一个绘图工具,可以画很多好看的图。
matlab的图一般都很丑,需要自己不断调试。而gramm默认的配色,基本可以直接使用。
参考:
https://github.com/piermorel/gramm
One more thing
科研常用工具列表,成为一个合格的板砖人(科研民工)
| 名字 | 价格 | 用处 |
|---|---|---|
| Office三件套 | 学校提供 | 略 |
| Mathtype | 收费 | 数学公式编辑(推荐搭配latex数学命令使用) |
| Typora | 收费 | markdown编辑器,本次分享使用markdown完成 |
| VScode | 免费 | 地表最强编辑器,我用vscode开发python, latex, markdown |
| Notion | 免费 | 个人知识库(上手很慢,但是可以很好规划你的生活) |
| Endnote | 学校提供 | 个人文献库(直接插入国标引用格式到word) |
| Calibre | 免费 | 个人图书馆 |
| 百度云 | 功能收费 | 备份+同步(一年不到200块,同步文件+备份文件) |
| Office 365 | 收费 | 与Office年度版本不同,这是订阅制的office,享受更多功能+1T 云盘 |
| Acrobat DC | 收费 | PDF编辑器 |
| Latex | 免费 | 写期刊论文使用,直接输出pdf |
| Overleaf / Slagger | 免费 | 在线latex |
| Powertoys | 免费 | Windows拓展工具(非常强大,保持唤醒、取色、分屏等等等) |
结语
Matlab优缺点
优点:
- Matlab (matrix laboratory) 是一流的矩阵(Matrix)计算工具,提供了强大的矩阵计算方法
- 预先定义好的功能,上手容易、语法简单(个人觉得比python还简单)
- 图形化的界面,独立的平台
- 来自官方的工具箱,长期支持和维护
缺点:
- 一些数据结构在matlab中是没有原生支持的(字典结构是最近加入的,以前使用字典,优先队列等需要调用java)
- 商业软件很少有公司使用,生存在科研机构,底层是闭源的
- 运行速度较慢
如何使用Matlab
- 使用正版,获得更多的技术支持,工具箱,社区等。
- 使用新版,获得更多的功能,更快的运行,更美的界面。
怎么学Matlab
- 只进行数值计算则matlab不是唯一选择(python, java等都可以),matlab的精髓是工具箱和仿真。
- 任何一门语言的技能成长过程是多写多看多练,练习中成长。(编程语言不是自然语言,朗读代码不会获得进步。)
希望各位能从今天的分享中收获自己想要的。感谢各位!